Doctors check the pulse for a quick assessment of a patient's health. This tool allows groundwater managers to do a similar assessment of changes in groundwater dependent ecosystem (GDE) health using satellite, rainfall, and groundwater data.
Feedback? Contact Kirk Klausmeyer
Please find versions 1, 2, and 2.1 of this application and data here:
https://gde.codefornature.org/v1/
© Copyright The Nature Conservancy. Terms of Use | Privacy Policy
Remote sensing data from satellites has been used to monitor the health of vegetation all over the planet. This section explains how remote sensing data can be used to monitor changes in the phenology of groundwater dependent ecosystems (GDEs). It also explains the methods and data sources used in the map-based application and API.
Remotely sensed data from satellites have been used to monitor the health of vegetation across the globe since the 1970s. With current advances in compauting, data processing capabilities, and easy access to satellite data, we are now able to develop methods to efficiently monitor natural systems in near real-time. The GDE Pulse web app developed by The Nature Conservancy provides users easy access to satellite data to view long term temporal trends of vegetation metrics. These vegetation metrics serve as an indicator of vegetation health for Groundwater Dependent Ecosystems (GDEs). In addition, the GDE Pulse web app provides long-term temporal trends of groundwater depth and regional precipitation data. This provides users with a platform to infer relationships between groundwater levels, precipitation, and GDE vegetation metrics to monitor and sustainably manage groundwater and GDEs.
Groundwater dependent ecosystems (GDEs) are plant and animal communities that solely or partially depend on the availability of groundwater to maintain their structure and function (Murray et al. 2003; Eamus and Froend 2006). GDEs are specifically defined under California's Sustainable Groundwater Management Act (SGMA) as “ecological communities or species that depend on groundwater emerging from aquifers or on groundwater occurring near the ground surface.” (Cal. Code Regs. tit. 23, §351(m), 2019). GDEs provide valuable functions that benefit people, such as purifying water, providing recreational opportunities, climate regulation, pollinators for nearby agricultural fields, and habitat for endangered species (Griebler and Avramov 2015).
The health of GDEs are affected by a variety of factors, including climate, pests, land management, water quality, and their ability to access groundwater (Brown et al. 2011; Groeneveld 2008; Patten, Rouse, and Stromberg 2008; Cooper et al. 2006; Elmore et al. 2006; Huntington et al. 2016). Kløve et al. (2011) in a review highlighted the significance of groundwater for different GDEs and highlighted the status and future risks of GDEs under altered climate and land use practices (Kløve et al. 2011). Removal or a change in the timing, quantity, quality, or distribution of groundwater can negatively influence these ecosystems and associated fauna assemblages, thus emphasizing the importance of monitoring groundwater levels and GDEs (Murray et al. 2003). The health of a GDE can be measured through a variety of metrics, including growth, species diversity, reproduction, interactions between species, and survivorship (the percent of plants that are alive from one year to the next) (Rohde et al. 2019). Ground based metrics are ideal for monitoring GDE health, but this information is expensive to collect and not available at a statewide scale.
Remotely sensed satellite data can provide a cost effective alternative to routinely monitor GDEs statewide. Remote sensing methods take advantage of different patterns of reflectance related to the level of surface moisture and/or photosynthetic chlorophyll present in vegetation. In the absence of field-based biophysical monitoring data, remotely sensed indices associated with vegetation moisture and chlorophyll can provide an indirect metric of growth and water stress. Both of these variables provide a preliminary proxy to monitor GDE health. Many studies have demonstrated the utility of satellite remote sensing to monitoring metrics of vegetation health like vigor, growth, and mortality using different spectral indices (Vogelmann et al. 2012; Huang et al. 2010; Asner et al. 2016; Healey et al. 2018). Free and easily available satellite data from Landsat sensors since 1984 presents a tremendous opportunity to evaluate the long-term trends of change in greenness and moisture content of GDEs over time. Researchers have also found that remotely sensed vegetation metrics, precipitation, and groundwater levels near GDEs are correlated and help to better understand the impact of groundwater extraction on GDE health (Huntington et al. 2016; Groeneveld 2008).
The influence of groundwater levels on GDE health is highly site-specific, and understanding this relationship requires an understanding of the local geology, aquifer parameters, land use history, and surface water deliveries. Many groundwater managers have this information for their local area, so the GDE Pulse tool can be used to augment local knowledge to enable ecosystems to be considered under sustainable groundwater management. The GDE Pulse tool provides groundwater managers with critical information to help them better understand the interplay and correlations between GDE vegetation metrics, local precipitation, and groundwater levels.
The GDE data used in the GDE Pulse web app are derived from the vegetation data included in the Natural Communities Commonly Associated with Groundwater Dataset Version 2.0 (NCCAG 2.0) (The Nature Conservancy 2021). We used the Google Earth Engine (GEE, Gorelick et al. 2017) application programming interface (API) to summarize the satellite data for each GDE polygon.
The Landsat mission launched by NASA in 1972 is the longest satellite monitoring program and has continuously acquired space-based moderate resolution (~30 m) images of the Earth's surface every 16 days. The Landsat satellites include four primary sensors that have evolved over thirty years: MSS (multi-spectral), TM (Thematic Mapper), ETM+ (Enhanced Thematic Mapper) and the Operational Land Imager (OLI). Each Landsat scene is composed of multiple spectral bands. The spectral bands are designed to record visible, near-infrared, middle-infrared and thermal wavelengths reflected from the Earth's surface.
Landsat data products are continually evolving and being refined to improve quality and ease of access. Currently pre-processed cloud-free images comprised of 6-8 bands from TM, ETM and OLI are available through GEE. These datasets are available across the entire state and as new images are collected they are made available to users on GEE in near-real time through Google’s computing infrastructure. For this study we ingested all surface reflectance corrected multispectral Landsat imagery (Landsat 5 TM, Landsat 7 ETM+ SLC on, and Landsat 8 OLI) available within GEE from 1984 to the present across the entire state of California. Images were processed further to mask clouds and cloud shadows using the CFmask algorithm (Zhu, Wang, and Woodcock 2015). We calculated the medoid (a multi-dimensional feature space median) for each year to reduce the spectral observations from the Landsat record to one image per year. We chose a timeframe of June 1 to September 30 for each year because GDE species are more likely using groundwater during the dry months than other times of the year (Huntington et al. 2016).
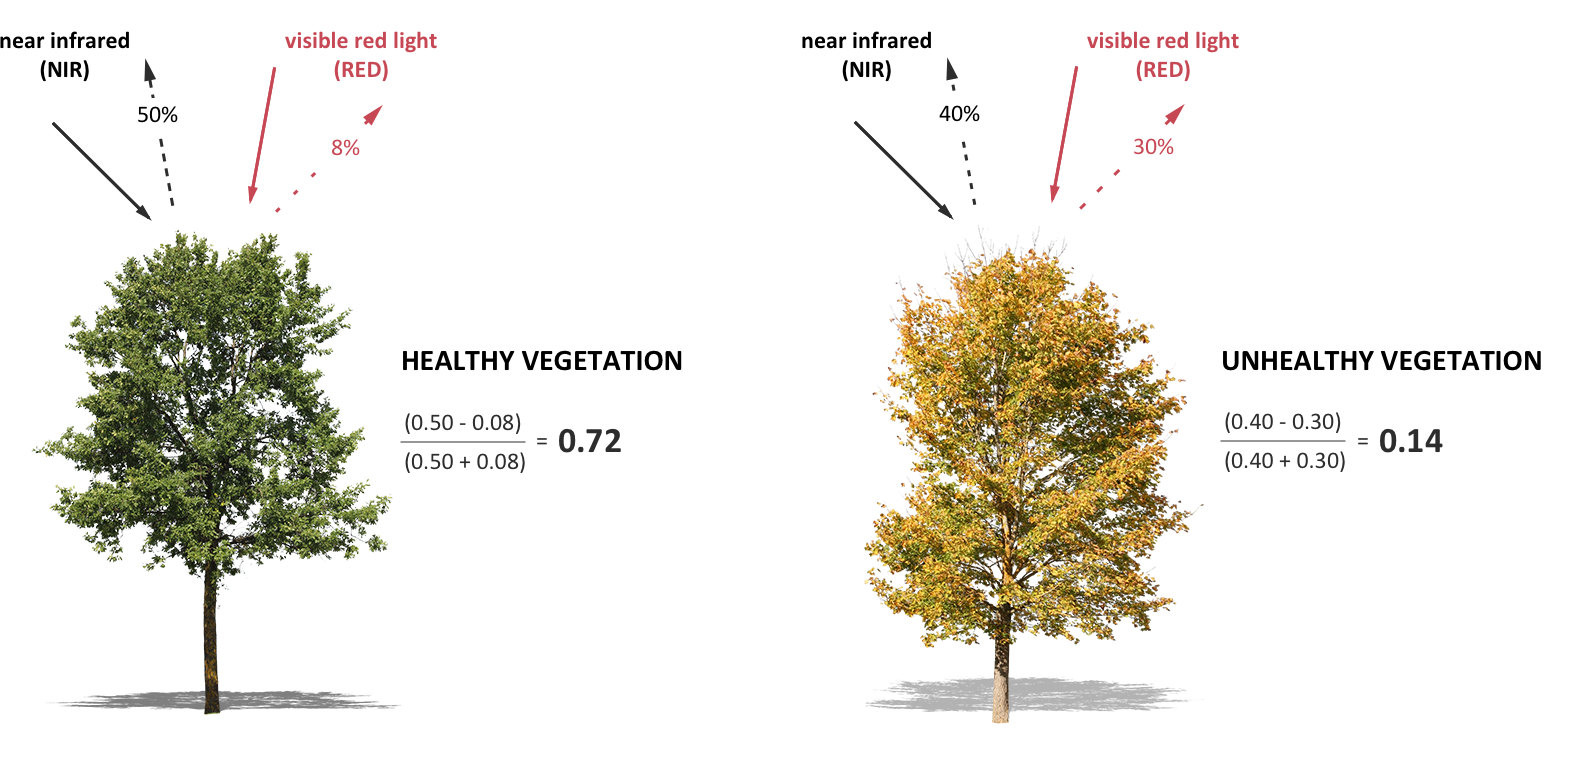
Using the annual dry-month medoids, we calculated the Normalized Derived Vegetation Index (NDVI) to estimate vegetation greenness and Normalized Derived Moisture Index (NDMI) to estimate vegetation moisture (Table 1). These vegetation metrics (VMs) were selected based on their documented relationship to the presence of photosynthetic chlorophyll or moisture (see sources in Table 1) and ability to provide a proxy for vegetation growth and water stress, which are helpful variables for inferring ecosystem health. Living vegetation absorbs radiation in portions of the visible spectrum and reflects in the near-infrared (NIR), whereas radiation in the red as well as shortwave-infrared (SWIR) is absorbed by water present in the vegetation. Therefore, NIR and red wavelengths are sensitive to variations in photosynthetic chlorophyll, and SWIR wavelengths are sensitive to variations in moisture. Numerous spectral vegetation indices have been used to study vegetation health, drought impacts on vegetation, and deforestation. NDVI is the most widely used VM in the literature and is a reliable measure of the photosynthetic chlorophyll content in leaves and vegetation cover (Figure 1) (Rouse et al. 1974; Jiang et al. 2006). NDVI has been used in several studies to identify terrestrial ecosystems and wetlands that depend on groundwater based on the principle that ecosystems that are able to maintain consistent greenness during a prolonged dry period, are defined as potentially groundwater-dependent (Gou, Gonzales, and Miller 2015; Barron et al. 2014; Doody et al. 2017). NDMI is based on the NIR and SWIR bands and is also widely used in the literature as a metric of vegetation moisture stress (Wilson and Sader 2002; Jin and Sader 2005).
Spectral Index | Equation | Source |
---|---|---|
NDVI | NDVI = (NIR – red)/(NIR + red) | (Rouse et al. 1974) |
NDMI | NDMI = (NIR – SWIR)/(NIR + SWIR1) | (Wilson and Sader 2002) |
After calculating NDVI and NDMI for the annual dry-month medoid Landsat image, summarized the average NDVI and NDMI for all the Landsat pixels that fall within each GDE polygon for each year. We calculated the linear trend in NDVI and NDMI for a) the entire time period (1985-present), b) the past 15 years, c) the past 10 years, and d) for the past 5 years for each landsat pixel within the GDE polygon mask. These averages and trend layers are available on the GDE Pulse web-map and allow the user to quickly see positive or negative trends in the two vegetation metrics at the native resolution of the landsat data.
Vegetation metrics like NDVI and NDMI could also be affected by local precipitation, so we summarize the annual precipitation for each GDE polygon. We used the monthly Parameter-elevation Regressions on Independent Slopes Model (PRISM) precipitation data at 2.5 arc-second resolution (~ 4 km) available in GEE (Daly, Smith, and Olson 2015; Daly et al. 2008). We summarized the data using the water year (October 1-September 30).
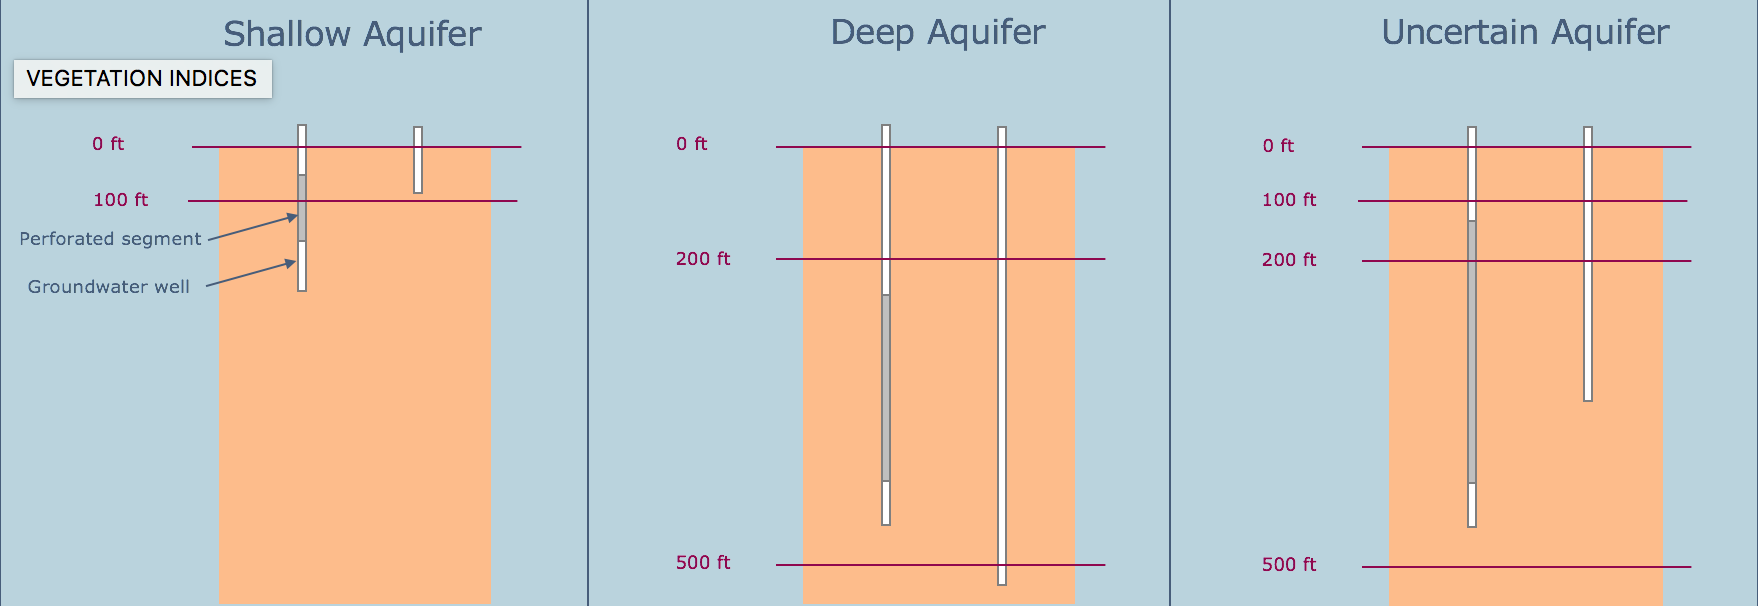
The groundwater depth data is derived from the California Department of Water Resources (DWR) Periodic Groundwater Level Measurement dataset. This dataset includes depth to groundwater measurements collected by DWR and other cooperating agencies including the U.S. Geological Survey, as well as information about the groundwater well (type, location, depth, perforated intervals). We classified the wells to estimate if the measurements reflect conditions in a shallow surficial aquifer or a deep confined aquifer (Figure 2). The measurements from shallow unconfined aquifers are most relevant to GDE health because the roots typically do not penetrate confining layers or extend below ~70 feet below the ground surface (Stromberg 2013; Fan et al. 2017). We classified wells as "Shallow Aquifer" if the total depth is 100 feet or less, or the top of the shallowest perforation is 100 feet deep or less. "Deep Aquifer" wells are deeper than 500 feet or the top of the shallowest perforation is deeper than 200 feet. All other wells were classified as "Uncertain Aquifer".
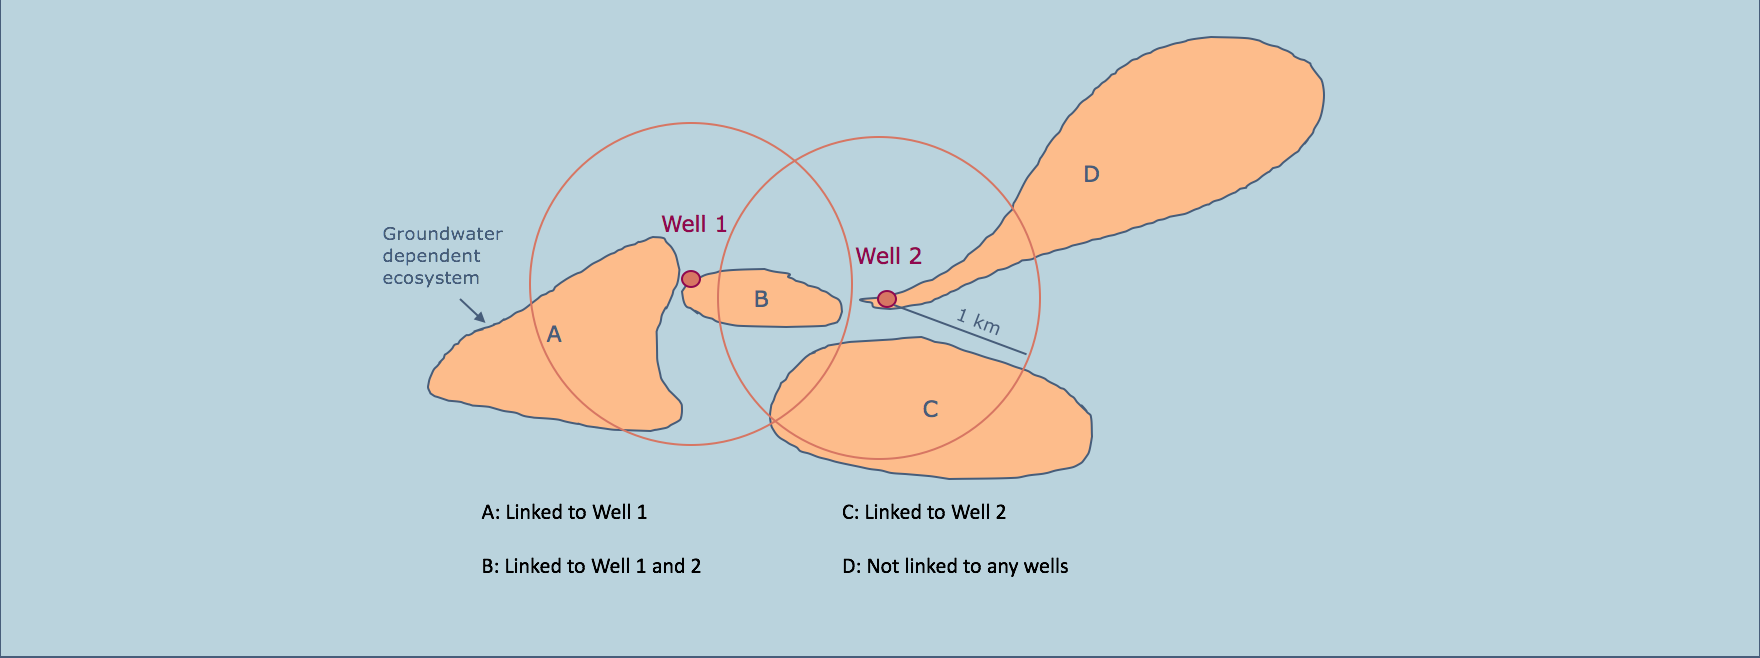
We estimated depth to groundwater for each GDE polygon by associating groundwater level data from nearby wells. We applied a 1 km buffer around each well and calculated the proportion of each GDE polygon that fell within the buffered area of the well. If the majority of the polygon area fell within the buffer, we associated the well with that polygon (Figure 3, polygons A and C). Some polygons have several nearby wells, so multiple wells were associated with the polygon and the data for all nearby wells are shown in the interactive map (Figure 3, polygon B). Some polygons have long irregular shapes, so even if a well intersected the polygon but the majority of the polygon fell outside of the buffer zone for that well, it was not associated with that well (Figure 3, polygon D). Some wells are located at a different elevation than the nearby GDE polygon. For example, a well might be located on a terrace while the GDE polygon is in a lower elevation floodplain area. To correct for this, we calculated the average elevation for each GDE polygon using the U.S. Geological Survey’s National Elevation Dataset (NED) available on GEE (U.S. Geological Survey 2019), and used that elevation to subtract from the measured groundwater elevation from the nearby well(s) to estimate the depth to groundwater below the GDE.
Out of the 246,017 vegetation polygons in the NCCAG V2.0 dataset, 564 (0.22%) were too small to include any center of a landsat pixel, so no landsat data are recorded for these polygons. The landsat data summarized in 36 annual dry-month medoids was queried in Google Earth Engine for the remaining 245,453 polygons for a total of 8,836,308 potential observations (36 years * 245,453 polygons). Of those potential observations, the Landsat data was missing from 1,447 data points (0.02%). Most of these missing observations are found in polygons along the coast and in the Sacramento / San Joaquin delta and are likely due to dry month fog conditions and clouds. The remaining 8,834,861 points for NDVI, NDMI, and precipitation data can be downloaded in a comma-separated-values (csv) formatted table the GDE Pulse data page. Users can also access the database API via a URL or scripting language like python or R (instructions and documentation are available on the GDE Pulse data page). To view charts of the data or download csv formatted tables for a single GDE polygon, users can use the GDE Pulse interactive map.
Of the 246,017 GDE polygons, only 18,749 (7.6%) have a groundwater well nearby (within 1 km) that has any groundwater level measurements since 1985. Only 6,516 (2.7%) of the GDE polygons have a nearby groundwater well with sufficient information recorded to classify it as likely measuring groundwater levels in a shallow aquifer. The remaining 92.4% of GDE polygons do not have any groundwater wells sufficiently close to estimate the trends in groundwater levels that may affect the health of the ecosystem. Groundwater level measurement data are available to view in the interactive map on the GDE Pulse web app. After selecting a groundwater well, users can download the measurement data in a comma-separated-value formatted table. A table that links each GDE polygon to a well is available for download via the data page on the GDE Pulse data page. Users can also access the database API via a URL or scripting language like python or R (instructions and documentation are available on the GDE Pulse data page). To download the entire well measurement database, please visit the California Department of Water Resources (DWR) Periodic Groundwater Level Measurement database. To view charts of the data or download csv formatted tables for a single GDE polygon, users can use the GDE Pulse interactive map.
Groundwater dependent ecosystems are a poorly understood yet vitally important component of the natural habitats and biodiversity in California. We found that despite having tens of thousands of groundwater wells in the state, there is insufficient data to monitor 92.4% of the patches of indicator vegetation for groundwater dependent ecosystems. With the passage of the Sustainable Groundwater Management Act, local groundwater sustainability agencies will be developing monitoring plans to ensure they are managing groundwater sustainably. Installing shallow groundwater monitoring wells near GDEs and reporting the data to the state CASGEM database is a vital step to improving the understanding and management of groundwater dependent ecosystems.
The GDE Pulse web app is designed to allow local groundwater managers to explore the data for any GDE polygon in the state, and compare that with trends in groundwater levels nearby if the data exist. We are currently doing an analysis of the relationship of groundwater levels and vegetation metrics statewide to find any patterns in the correlation of these two metrics of GDE health, and we will publish those results when they are available. In the meantime, we urge groundwater managers and interested stakeholders to review the data on the GDE Pulse web app to inform and improve groundwater management for healthier ecosystems.
Asner, Gregory P., Philip G. Brodrick, Christopher B. Anderson, Nicholas Vaughn, David E. Knapp, and Roberta E. Martin. 2016. “Progressive Forest Canopy Water Loss during the 2012–2015 California Drought.” Proceedings of the National Academy of Sciences. https://doi.org/10.1073/pnas.1523397113.
Barron, Olga V., Irina Emelyanova, Thomas G. Van Niel, Daniel Pollock, and Geoff Hodgson. 2014. “Mapping Groundwater-Dependent Ecosystems Using Remote Sensing Measures of Vegetation and Moisture Dynamics.” Hydrological Processes. https://doi.org/10.1002/hyp.9609.
Brown, Jenny, Leslie Bach, Allison Aldous, Abby Wyers, and Julia DeGagné. 2011. “Groundwater-Dependent Ecosystems in Oregon: An Assessment of Their Distribution and Associated Threats.” Frontiers in Ecology and the Environment. https://doi.org/10.1890/090108.
Cooper, David J., John S. Sanderson, David I. Stannard, and David P. Groeneveld. 2006. “Effects of Long-Term Water Table Drawdown on Evapotranspiration and Vegetation in an Arid Region Phreatophyte Community.” Journal of Hydrology. https://doi.org/10.1016/j.jhydrol.2005.09.035.
Daly, Christopher, Michael Halbleib, Joseph I. Smith, Wayne P. Gibson, Matthew K. Doggett, George H. Taylor, Jan Curtis, and Phillip P. Pasteris. 2008. “Physiographically Sensitive Mapping of Climatological Temperature and Precipitation across the Conterminous United States.” International Journal of Climatology. https://doi.org/10.1002/joc.1688.
Daly, Christopher, Joseph I. Smith, and Keith V. Olson. 2015. “Mapping Atmospheric Moisture Climatologies across the Conterminous United States.” PloS One 10 (10): e0141140.
Doody, Tanya M., Olga V. Barron, Kate Dowsley, Irina Emelyanova, Jon Fawcett, Ian C. Overton, Jodie L. Pritchard, Albert I. J. M. Van Dijk, and Garth Warren. 2017. “Continental Mapping of Groundwater Dependent Ecosystems: A Methodological Framework to Integrate Diverse Data and Expert Opinion.” Journal of Hydrology: Regional Studies. https://doi.org/10.1016/j.ejrh.2017.01.003.
Eamus, Derek, and Ray Froend. 2006. “Groundwater-Dependent Ecosystems: The Where, What and Why of GDEs.” Australian Journal of Botany. https://doi.org/10.1071/bt06029.
Elmore, Andrew J., Sara J. Manning, John F. Mustard, and Joseph M. Craine. 2006. “Decline in Alkali Meadow Vegetation Cover in California: The Effects of Groundwater Extraction and Drought.” Journal of Applied Ecology. https://doi.org/10.1111/j.1365-2664.2006.01197.x.
Fan, Ying, Gonzalo Miguez-Macho, Esteban G. Jobbágy, Robert B. Jackson, and Carlos Otero-Casal. 2017. “Hydrologic Regulation of Plant Rooting Depth.” Proceedings of the National Academy of Sciences of the United States of America 114 (40): 10572–77.
Gorelick, Noel, Matt Hancher, Mike Dixon, Simon Ilyushchenko, David Thau, and Rebecca Moore. 2017. “Google Earth Engine: Planetary-Scale Geospatial Analysis for Everyone.” Remote Sensing of Environment. https://doi.org/10.1016/j.rse.2017.06.031.
Gou, Si, Susana Gonzales, and Gretchen R. Miller. 2015. “Mapping Potential Groundwater-Dependent Ecosystems for Sustainable Management.” Ground Water 53 (1): 99–110.
Griebler, Christian, and Maria Avramov. 2015. “Groundwater Ecosystem Services: A Review.” Freshwater Science. https://doi.org/10.1086/679903.
Groeneveld, David P. 2008. “Remotely-Sensed Groundwater Evapotranspiration from Alkali Scrub Affected by Declining Water Table.” Journal of Hydrology. https://doi.org/10.1016/j.jhydrol.2008.06.011.
Healey, Sean P., Warren B. Cohen, Zhiqiang Yang, C. Kenneth Brewer, Evan B. Brooks, Noel Gorelick, Alexander J. Hernandez, et al. 2018. “Mapping Forest Change Using Stacked Generalization: An Ensemble Approach.” Remote Sensing of Environment. https://doi.org/10.1016/j.rse.2017.09.029.
Huang, Chengquan, Samuel N. Goward, Jeffrey G. Masek, Nancy Thomas, Zhiliang Zhu, and James E. Vogelmann. 2010. “An Automated Approach for Reconstructing Recent Forest Disturbance History Using Dense Landsat Time Series Stacks.” Remote Sensing of Environment. https://doi.org/10.1016/j.rse.2009.08.017.
Huntington, Justin, Kenneth McGwire, Charles Morton, Keirith Snyder, Sarah Peterson, Tyler Erickson, Richard Niswonger, Rosemary Carroll, Guy Smith, and Richard Allen. 2016. “Assessing the Role of Climate and Resource Management on Groundwater Dependent Ecosystem Changes in Arid Environments with the Landsat Archive.” Remote Sensing of Environment. https://doi.org/10.1016/j.rse.2016.07.004.
Jiang, Zhangyan, Alfredo R. Huete, Jin Chen, Yunhao Chen, Jing Li, Guangjian Yan, and Xiaoyu Zhang. 2006. “Analysis of NDVI and Scaled Difference Vegetation Index Retrievals of Vegetation Fraction.” Remote Sensing of Environment. https://doi.org/10.1016/j.rse.2006.01.003.
Jin, Suming, and Steven A. Sader. 2005. “Comparison of Time Series Tasseled Cap Wetness and the Normalized Difference Moisture Index in Detecting Forest Disturbances.” Remote Sensing of Environment. https://doi.org/10.1016/j.rse.2004.10.012.
Klausmeyer, Kirk R., Jeanette Howard, Todd Keeler-Wolf, Kristal Davis-Fadtke, Roy Hull, and Amy Lyons. 2018. “Mapping Indicators of Groundwater Dependent Ecosystems in California: Methods Report.” San Francisco, California. https://groundwaterresourcehub.org/public/uploads/pdfs/GDE_data_paper_20180423.pdf.
Kløve, Bjørn, Pertti Ala-aho, Guillaume Bertrand, Zuzana Boukalova, Ali Ertürk, Nico Goldscheider, Jari Ilmonen, et al. 2011. “Groundwater Dependent Ecosystems. Part I: Hydroecological Status and Trends.” Environmental Science & Policy. https://doi.org/10.1016/j.envsci.2011.04.002.
Murray, By Brad R., Melanie J. B. Zeppel, Grant C. Hose, and Derek Eamus. 2003. “Groundwater-Dependent Ecosystems in Australia: It’s More than Just Water for Rivers.” Ecological Management and Restoration. https://doi.org/10.1046/j.1442-8903.2003.00144.x.
The Nature Conservancy, California. 2021. Natural Communities Commonly Associated with Groundwater Version 2.0 (NCCAG 2.0). https://gde.codefornature.org/data/i02_NaturalCommunitiesCommonlyAssociatedwithGroundwater_v2_0.gdb.zip . Accessed August 31, 2021.
Patten, Duncan T., Leigh Rouse, and Juliet C. Stromberg. 2008. “Isolated Spring Wetlands in the Great Basin and Mojave Deserts, USA: Potential Response of Vegetation to Groundwater Withdrawal.” Environmental Management 41 (3): 398–413.
Rohde, Melissa M., Sara Sweet, Craig Ulrich, and Jeanette Howard, 2019. “A Transdisciplinary Approach to Characterize Hydrological Controls on Groundwater-Dependent Ecosystem Health.” Frontiers in Ecology and the Environment. https://doi.org/10.3389/fenvs.2019.00175
Rouse, J. W., Haas R., J. A., and D. W. Deering. 1974. “Monitoring Vegetation Systems in the Great Plains with ERTS.” In Third Earth Resources Technology Satellite-1 Symposium. Volume 1: Technical Presentations, Section A, edited by S. C. Freden, E. P. Mercanti, and M. A. Becker, 309–17. NASA-SP-351-VOL-1-SECT-A. NASA.
Stromberg, J. C. 2013. “Root Patterns and Hydrogeomorphic Niches of Riparian Plants in the American Southwest.” Journal of Arid Environments. https://doi.org/10.1016/j.jaridenv.2013.02.004.
U.S. Geological Survey. 2019. “National Elevation Dataset.” https://developers.google.com/earth-engine/datasets/catalog/USGS_NED.
Vogelmann, James E., George Xian, Collin Homer, and Brian Tolk. 2012. “Monitoring Gradual Ecosystem Change Using Landsat Time Series Analyses: Case Studies in Selected Forest and Rangeland Ecosystems.” Remote Sensing of Environment. https://doi.org/10.1016/j.rse.2011.06.027.
Wilson, Emily Hoffhine, and Steven A. Sader. 2002. “Detection of Forest Harvest Type Using Multiple Dates of Landsat TM Imagery.” Remote Sensing of Environment. https://doi.org/10.1016/s0034-4257(01)00318-2.
Zhu, Zhe, Shixiong Wang, and Curtis E. Woodcock. 2015. “Improvement and Expansion of the Fmask Algorithm: Cloud, Cloud Shadow, and Snow Detection for Landsats 4–7, 8, and Sentinel 2 Images.” Remote Sensing of Environment. https://doi.org/10.1016/j.rse.2014.12.014.
Feedback? Contact Kirk Klausmeyer
Please find versions 1, 2, and 2.1 of this application and data here:
https://gde.codefornature.org/v1/
© Copyright The Nature Conservancy. Terms of Use | Privacy Policy
In addition to the map-based viewer and download tool, GDE Pulse Version 2.2 data can be downloaded in bulk or accessed programmatically through a RESTful Application Programming Interface (API).
The following files contain the vegetation metrics and precipitation data for groundwater dependent vegetation polygons. The data is broken up into multiple files to allow users to open them in MS Excel ( which has a 1,048,576 rows per sheet limit):
https://gde.codefornature.org/data/gde_v22_1.csv
(GDEs: 1-34000, 28MB)
https://gde.codefornature.org/data/gde_v22_2.csv
(GDEs: 34001-68000, 27MB)
https://gde.codefornature.org/data/gde_v22_3.csv
(GDEs: 69001-121000, 28MB)
https://gde.codefornature.org/data/gde_v22_4.csv
(GDEs: 121001-310000, 28MB)
https://gde.codefornature.org/data/gde_v22_5.csv
(GDEs: 310001-342000, 30MB)
https://gde.codefornature.org/data/gde_v22_6.csv
(GDEs: 342001-392000, 28MB)
https://gde.codefornature.org/data/gde_v22_7.csv
(GDEs: 392001-475000, 30MB)
https://gde.codefornature.org/data/gde_v22_8.csv
(GDEs: 475001-515000, 29MB)
https://gde.codefornature.org/data/gde_v22_9.csv
(GDEs: 515001-590000, 29MB)
https://gde.codefornature.org/data/gde_v22_10.csv
(GDEs: 590001-595433, 4MB)
Field name | Description |
---|---|
gde | The unique identifier for each GDE polygon. This is the same identifier as the “POLYGON_ID” in the Natural Communities Commonly Associated with Groundwater Version 2.0 dataset ( https://gde.codefornature.org/data/i02_NaturalCommunitiesCommonlyAssociatedwithGroundwater_v2_0.gdb.zip/) |
year | The year for which the data was measured or modeled |
ndvi | The Normalized Difference Vegetation Index (NDVI) is a satellite-derived index that represents the greenness of vegetation. We calculated the average NDVI for each GDE polygon from Landsat data during the driest part of the year (June 1-Sept 30) to estimate vegetation health when the plants are most likely dependent on groundwater. |
ndmi | The Normalized Difference Moisture Index (NDMI) is a satellite-derived index that represents water content in vegetation. NDMI is derived from the Near-Infrared (NIR) and Short Wave Infrared (SWIR) channels. We calculated the average NDVI for each GDE polygon from Landsat data during the driest part of the year (June 1-Sept 30) to estimate vegetation health when the plants are most likely dependent on groundwater. |
precip | The total precipitation in inches for the water year (October 1st of the previous year to September 30th of the current year) from the PRISM dataset ( http://www.prism.oregonstate.edu/). |
The following CSV file contains a table that links GDE polygons to the nearby wells based on the rule that the majority of the polygon has to be within 1 km of the well. There can be more than one well record per GDE polygon, and wells can be adjacent to multiple GDEs (many-to-many):
https://gde.codefornature.org/data/gdes-wells-assoc.csv (1.2Mb)
Field name | Description |
---|---|
gde_id | The unique identifier for each GDE polygon. This is the same identifier as the “POLYGON_ID” in the Natural Communities Commonly Associated with Groundwater Version 2.0 dataset ( https://gde.codefornature.org/data/i02_NaturalCommunitiesCommonlyAssociatedwithGroundwater_v2_0.gdb.zip/) |
site_code | Location based 18 character alphanumeric code assigned to each groundwater well or station tracked in “Stations” table the DWR Periodic Groundwater Level Measurement database ( https://data.cnra.ca.gov/dataset/periodic-groundwater-level-measurements ) |
type | Well classification based on the depth to the top of the screening interval(s) and/or the total depth of the well. “Shallow” indicates the well is likely measuring the groundwater levels of the shallow or surficial aquifer, and “uncertain” indicates there is not enough information to make a determination. “Deep” wells are not included in this table because deep aquifers are not likely to provide water to groundwater dependent ecosystems. |
The following table describes the fields that are available in the interactive map for download for an individual well. The full groundwater level data set is available for download at an external site:
https://data.cnra.ca.gov/dataset/periodic-groundwater-level-measurements
Field name | Description |
---|---|
site_code | Location based 18 character alphanumeric code assigned to each well. Groundwater well or station tracked in “Stations” table the DWR Periodic Groundwater Level Measurement database |
date | Date/Time (in PST) the groundwater level measurement was collected |
wse | Groundwater surface elevation in feet referenced to the North American Vertical Datum of 1988 (NAVD88) |
gse_wse | Groundwater surface elevation in feet referenced to the North American Vertical Datum of 1988 (NAVD88) |
quality_desc | Quality assurance description for groundwater level measurement |
accuracy_desc | Description for accuracy of groundwater level (elevation) measurement |
comments | Comments on the groundwater level measurement |
This section describes the version 2.2 of the GDE API https://gde-api.codefornature.org/v22/. The prior three versions are still available, the older endpoints still work. You can find them using the original URLs https://gde.codefornature.org/api/, https://gde.codefornature.org/v2/, or https://gde.codefornature.org/v21/. Please migrate any application relying on the versions 1, 2, or 2.1 as soon as possible.
There are two major changes in version 2.2:
1. Data availability up to 2023.
2. More reasonable precision (4 digits) for NDVI and NDMI values.
The RESTful API is publicly available for complex data analysis. It can be used with any coding language that supports HTTP requests such as Python, R, JavaScript, and many others as well as from the command line using e.g. curl. In response to GET requests, the API will return CSV formatted data to your script or application. Please contact falk.schuetzenmeister@tnc.org for further questions.
You can test the API in your web browser. One of the entry points
is https://gde-api.codefornature.org/v22/gde/{gde_id}/
(see the next section for the full list of API resources).
The trailing slash at the end of the URL is required. Replace
{gde_id}
with an actual GDE polygon id and the API will
return a time series of average summer NDVI, average summer NDMI, and
annual precipitation (in inches) as a CSV download (Content-type:
text/csv).
To download actual data, please try
https://gde-api.codefornature.org/v22/gdes/146245/
to get started. This request will return data for the
GDE polygon with the id 146245. The reference data (Natural
Communities Commonly Associated with Groundwater), the associated
metadata, as well as an ESRI FeatureService can be found at
https://data.cnra.ca.gov/dataset/natural-communities-commonly-associated-with-groundwater.
The requests above will trigger CSV downloads that will be identically formatted and named as downloads from the map-based tool:
gde,year,ndvi,ndmi,precip
146245,1985,0.109,-0.149,5
146245,1986,0.123,-0.131,7
146245,1987,0.102,-0.14,3
146245,1988,0.097,-0.146,6
146245,1989,0.078,-0.138,4
146245,1990,0.0803,-0.138,4
...
The second central resource of the project are groundwater
measurements at wells across the state. They can be accessed using
https://gde-api.codefornature.org/v22/measurements/{site_code}/
site_code
stands for the 18 digit site code assigned to each
groundwater well or station tracked in the “Stations” table
of the California Department of Water Resources Periodic Groundwater Level
Measurement database
For example
https://gde-api.codefornature.org/v22/measurements/373504N1184134W001/
site_code,date,wse,gse_wse,quality_desc,accuracy_desc,comments
373504N1184134W001,1985-02-05 15:30:00,4191.15,9.15,,Water level accuracy to nearest tenth of a foot,
373504N1184134W001,1985-04-03 14:55:00,4190.36,9.94,,Water level accuracy to nearest tenth of a foot,
373504N1184134W001,1985-06-05 10:35:00,4188.37,11.93,,Water level accuracy to nearest tenth of a foot,
373504N1184134W001,1985-08-08 15:40:00,4186.65,13.65,,Water level accuracy to nearest tenth of a foot,
373504N1184134W001,1985-10-10 13:15:00,4189.72,10.58,,Water level accuracy to nearest tenth of a foot,
373504N1184134W001,1985-12-04 15:30:00,4191.37,8.93,,Water level accuracy to nearest tenth of a foot
...
GET https://gde-api.codefornature.org/v22/gde/{gde_id}/
Response: Content-Type: text/csv; Access-Control-Allow-Origin: *; Content-Disposition: attachment; filename=gdes_{gde_id}.csv
GET https://gde-api.codefornature.org/v22/measurements/{site_code}/
Response: Content-Type: text/csv; Access-Control-Allow-Origin: *; Content-Disposition: attachment; filename=measurements_{site_code}.csv
The GDE Pulse API is a read-only API therefore we are not concerned about security breaches. In the future we might need to restrict the amount of data that can be requested per time unit by a user in order to limit resource use (throttling).
Once implemented, you will be able to obtain an access token from this page and the documentation will be updated accordingly.
Please don't rely on this API to build web applications since we cannot guarantee availability, performance, or scalability. Please contact us if you want to build something awesome with this data. Feel free to prototype, the API is CORS enabled.
Error handling is not yet fully implemented and malformed query
parameters (e.g. wrong data types or invalid special characters)
might occasionally result in an Internal Server Error
(500) when it should actually return a Not found
(404) or
Bad Request
(400) instead.
You might get a Moved Permanently
(301) status
message for queries that worked perfectly fine in a browser. The
reason is that requests using the HTTP protocol will be redirected
to the secure HTTPS protocol. Another reason could be that you
forgot the trailing slash in the URL. While your browser
will just follow these redirects the http function in your scripting
language might not. Curl will follow redirects only if provided with
the -L flag. Make sure to always request with the correct protocol
(https://
) and the trailing slash at the end of the URL.
Accept
headers are currently ignored.
Content-Type: text/csv
will be served no matter what.
The API does not issue Not Acceptable
(406)
errors or any other data format than CSV. Make sure that your code
can handle the response.
Please use these code examples to get started in Python. The examples require at least Python version 3.5.2
.# download_single.py
"""
Download GDE data using GDE API v2.1 and Python.
Requires Python 3.5 or higher.
"""
# standard library
import urllib.request
import sys
URL_TEMPLATE = 'https://gde-api.codefornature.org/v22/gdes/{}/'
def main():
"""
The main method
"""
gde_id = 146245
url = URL_TEMPLATE.format(gde_id)
# this is commented out in order to get a clean CSV return
# print('Requested URL', url)
with urllib.request.urlopen(url) as csv_file:
for line in csv_file:
print(line.decode('utf8'), end='')
if __name__ == '__main__':
main()
If the goal is to request data for a list of GDEs you could start from this example which also manages CSV headers for consecutive requests.
# download_multiple.py
"""
Download data for multiple GDEs using API v2.2 and Python.
Requires Python 3.5 or higher.
"""
# standard library
import urllib.request
URL_TEMPLATE = 'https://gde-api.codefornature.org/v22/gdes/{}/'
def main():
gde_list = [146245, 146325, 148587]
# we only store the header of the first file
first_line = 0
for item in gde_list:
url = URL_TEMPLATE.format(item)
with urllib.request.urlopen(url) as csv_file:
for line in list(csv_file):
print(line.decode('utf8'), end='')
first_line = 1
if __name__ == '__main__':
main()
Here is a very simple R example which is not yet equivalent to the Python example above:
library(httr)
url <- "https://gde-api.codefornature.org/v22/gdes/146245/"
r <- GET(url)
# The content function of the httr library uses the Content-Type header
# to determine how to parse the data, text/csv in our case
content(r)
Feedback? Contact Kirk Klausmeyer
Please find versions 1, 2, and 2.1 of this application and data here:
https://gde.codefornature.org/v1/
© Copyright The Nature Conservancy. Terms of Use | Privacy Policy
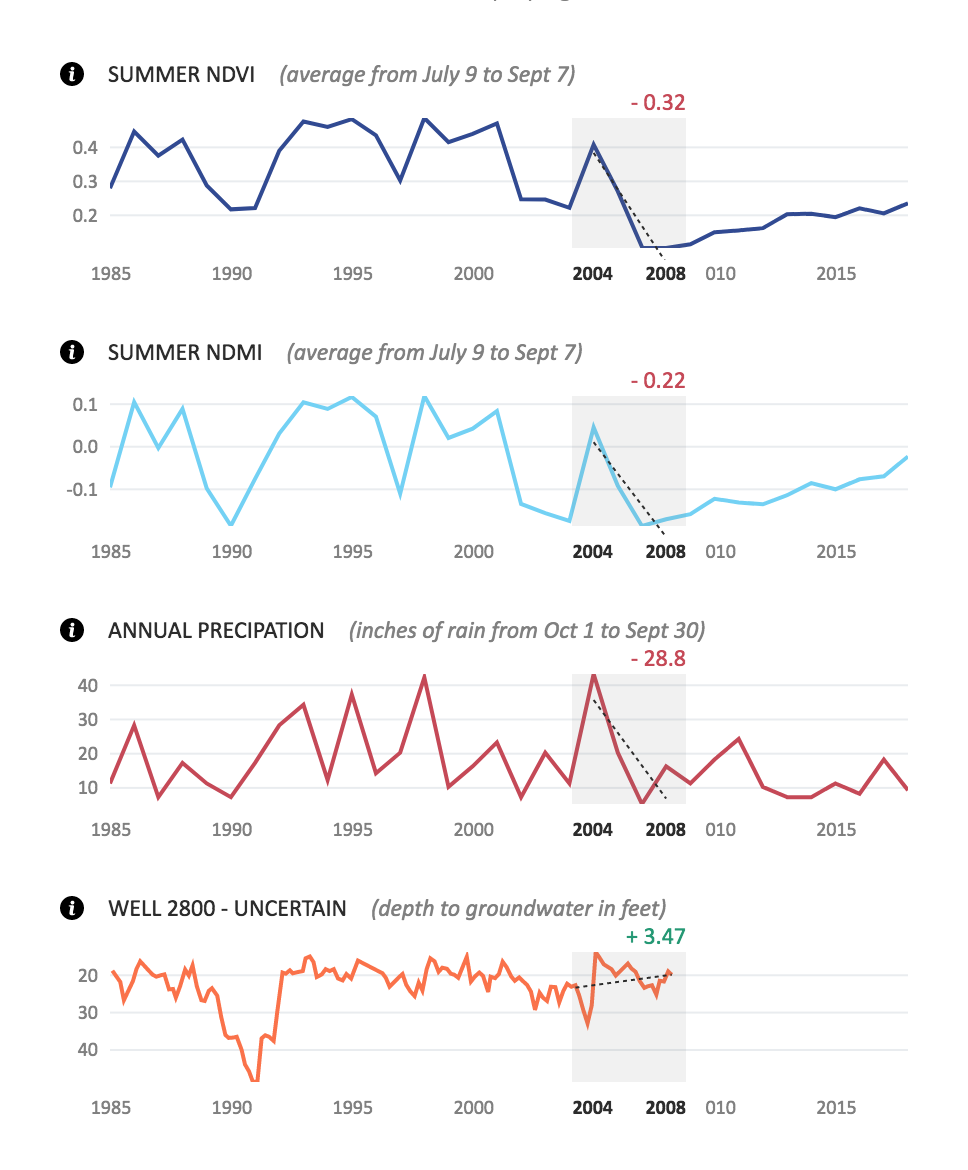
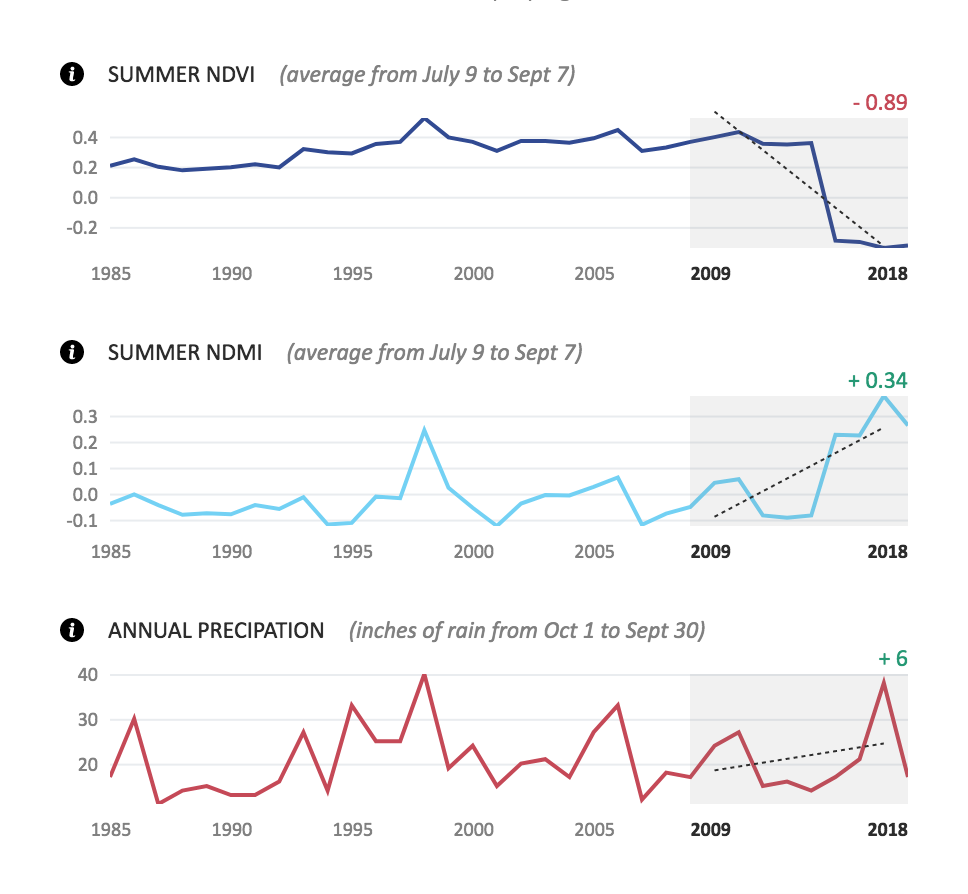
The light-gray box within each chart is a ‘trend window’ that allows you to gain quick insight into how each metric changed over a period of time. The dotted line within the trend window represents the trendline - a linear regression of the available data points within the window. On the top of the trend window you’ll see a number reflecting the absolute change from the beginning of the trend line to the end of the trend line.
To check out a different time period, you can move the trend window and change its size by clicking and dragging it!
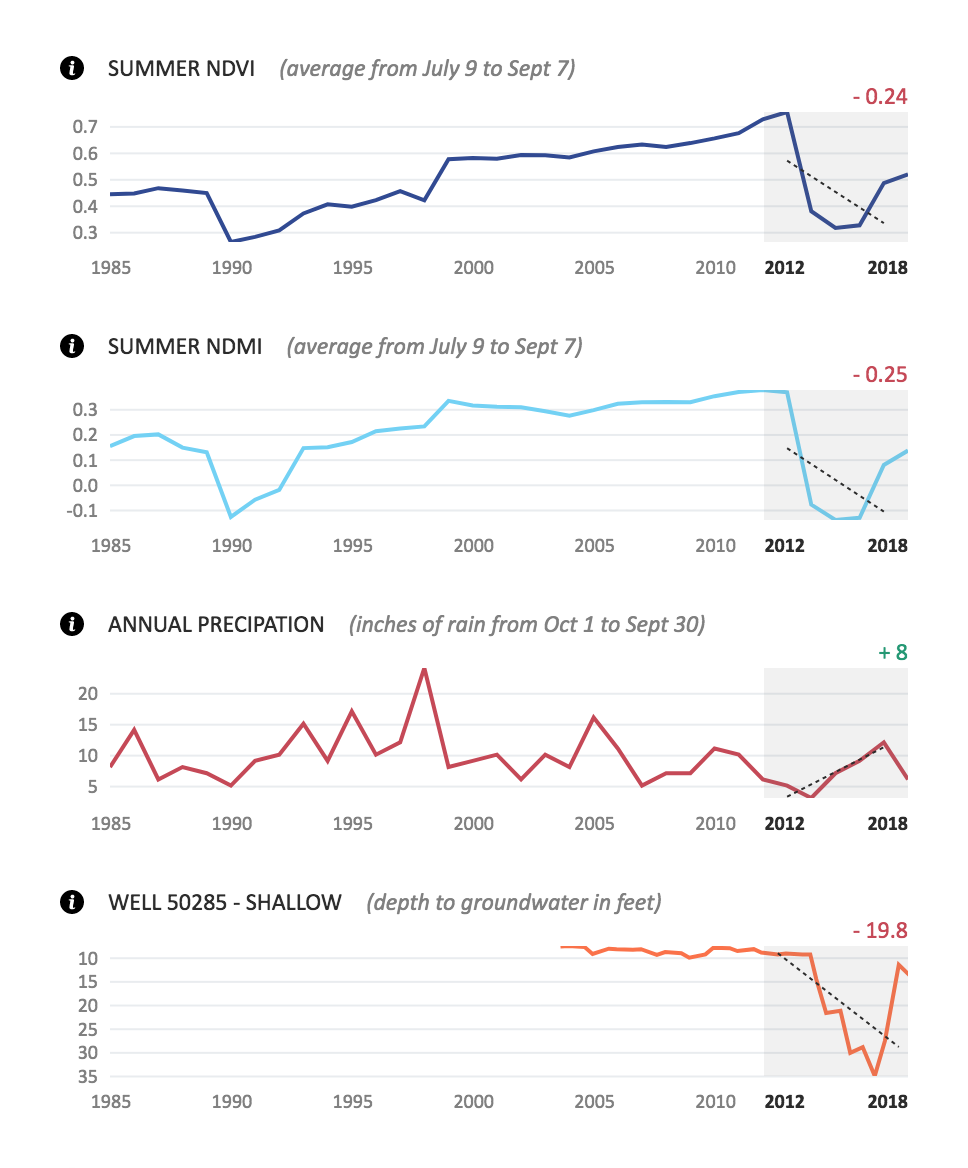
In this example on the Salinas River (GDE ID 35979), the vegetation metrics (blue lines) are highly correlated and both show a decline in 1990 and then a gradual increase until 2012 when there was a more pronounced decline and then an increase in 2017. The precipitation (red line) also shows low values in 1990 and 2012, but there is more variability in the intervening years that are not reflected in the vegetation metrics. The monitoring of groundwater levels (orange line) started in 2003 and were steady until a decline in 2012 and then recovery in 2017. The vegetation metrics and groundwater well data are highly correlated.
More research is needed, but until the cause of the decline is determined, we would recommend minimizing groundwater pumping near these groundwater dependent ecosystems (GDEs) when groundwater levels fall below 15 feet below the elevation of the GDE.
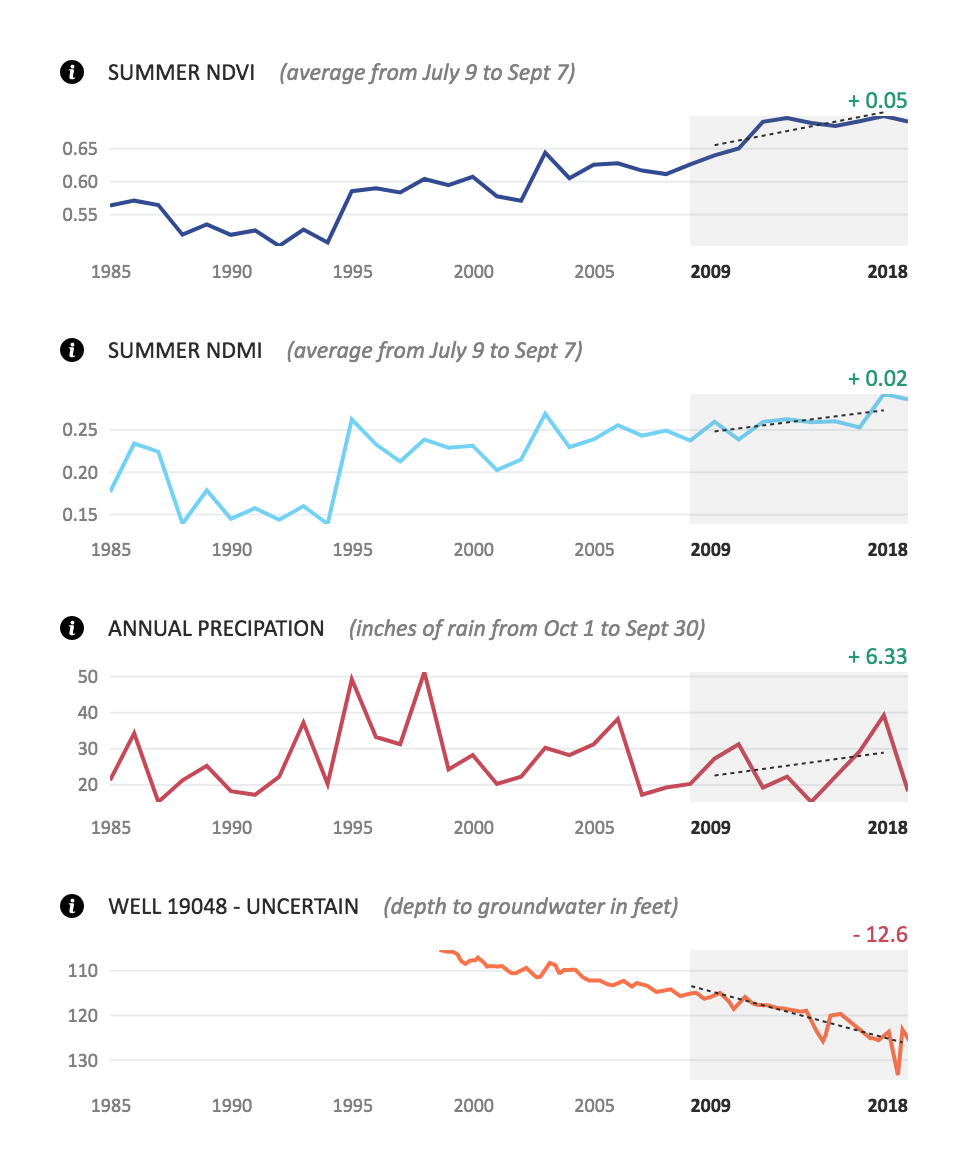
In this location along Deer Creek in Tehama County (GDE ID 132013), both vegetation metrics (blue lines) show and upward trend since about 1990, while the groundwater levels (orange line) show a decline since 1998 when the measurements began. The groundwater levels are relatively deep (>100 feet) so it is likely the GDE is relying on a more shallow perched aquifer that is not being monitored.
In this case, we would recommend installing shallow monitoring wells in the perched aquifer to better track how groundwater levels may affect the health of the GDE.
In this GDE along the Santa Clara river (GDE ID 88609), the vegetation metrics (blue lines) and the groundwater levels (orange line) show similar patterns until about 2004. At that point there is a large decline in NDVI and NDMI, and then a steady increase, while the groundwater level data stays the same. In this particular case, the native vegetation was cleared in 2005-2006 to build housing and a sports field. Thus, the change in the vegetation metrics is not reflected in the groundwater level data after 2005 because there was a land use change.
In this location (GDE ID 67719) in the northern part of San Pablo Bay, the NDVI (dark blue line) and the NDMI (light blue line) show opposite trends after 2013. This location was a leveed island with Tule marshes until the levees were breached and the island was flooded in 2014-2015. NDVI measures greeness so the flooding of the vegetation caused a drop, while NDMI measures moisture, which went up with the flooding.
For more information about the NDVI and NDMI indices, please see this reference page.
Feedback? Contact Kirk Klausmeyer
Please find versions 1, 2, and 2.1 of this application and data here:
https://gde.codefornature.org/v1/
© Copyright The Nature Conservancy. Terms of Use | Privacy Policy
The GDE Pulse website is made available under the Open Database License. Find the terms and conditions at opendatacommons.org.
The website and all its data are "as is" and "as available" without warranty of any kind either express or implied, including but not limited to the implied warranties of merchantability, fitness for a particular purpose, freedom from contamination by computer viruses and malware, and non-infringement. The Nature Conservancy makes no warranty as to the accuracy, completeness or reliability of any data available through the database and the website. You are responsible for verifying any information before relying on it. Use of the website, database, and the data is at your sole risk. If you have obtained data from a source other than https://gde.codefornature.org, be aware that electronic data can be altered subsequent to original distribution. Data can also quickly become out-of-date.
To the maximum extent permitted by law, The Nature Conservancy disclaims all liability, whether based in contract, tort (including negligence), strict liability or otherwise, and further disclaims all losses, including without limitation indirect, incidental, consequential, or special damages arising out of or in any way connected with access to or use of the website, database, or the data even if The Nature Conservancy has been advised of the possibility of such damages.
When using this dataset please use the following citation:
Kirk R. Klausmeyer, Falk Schuetzenmeister, Nathaniel Rindlaub, Tanushree Biswas, Melissa M. Rohde, Ian Houseman, Jeanette Howard. GDE Pulse: Taking the Pulse of Groundwater Dependent Ecosystems with Satellites and Groundwater Level Data v0.1.0. The Nature Conservancy. San Francisco CA. April 2019. https://gde.codefornature.org. (Date Accessed)
Feedback? Contact Kirk Klausmeyer
Please find versions 1, 2, and 2.1 of this application and data here:
https://gde.codefornature.org/v1/
© Copyright The Nature Conservancy. Terms of Use | Privacy Policy